How State Lines Shape America's Unemployment Insurance Safety Net
If you lose your job tomorrow, the safety net waiting for you depends entirely on which side of a state line you live on.
Consider two software engineers who lose their jobs on the same day due to company layoffs. They have similar experience, earned similar salaries, and face identical job market conditions. The only difference? One lives in Massachusetts, the other in Mississippi.
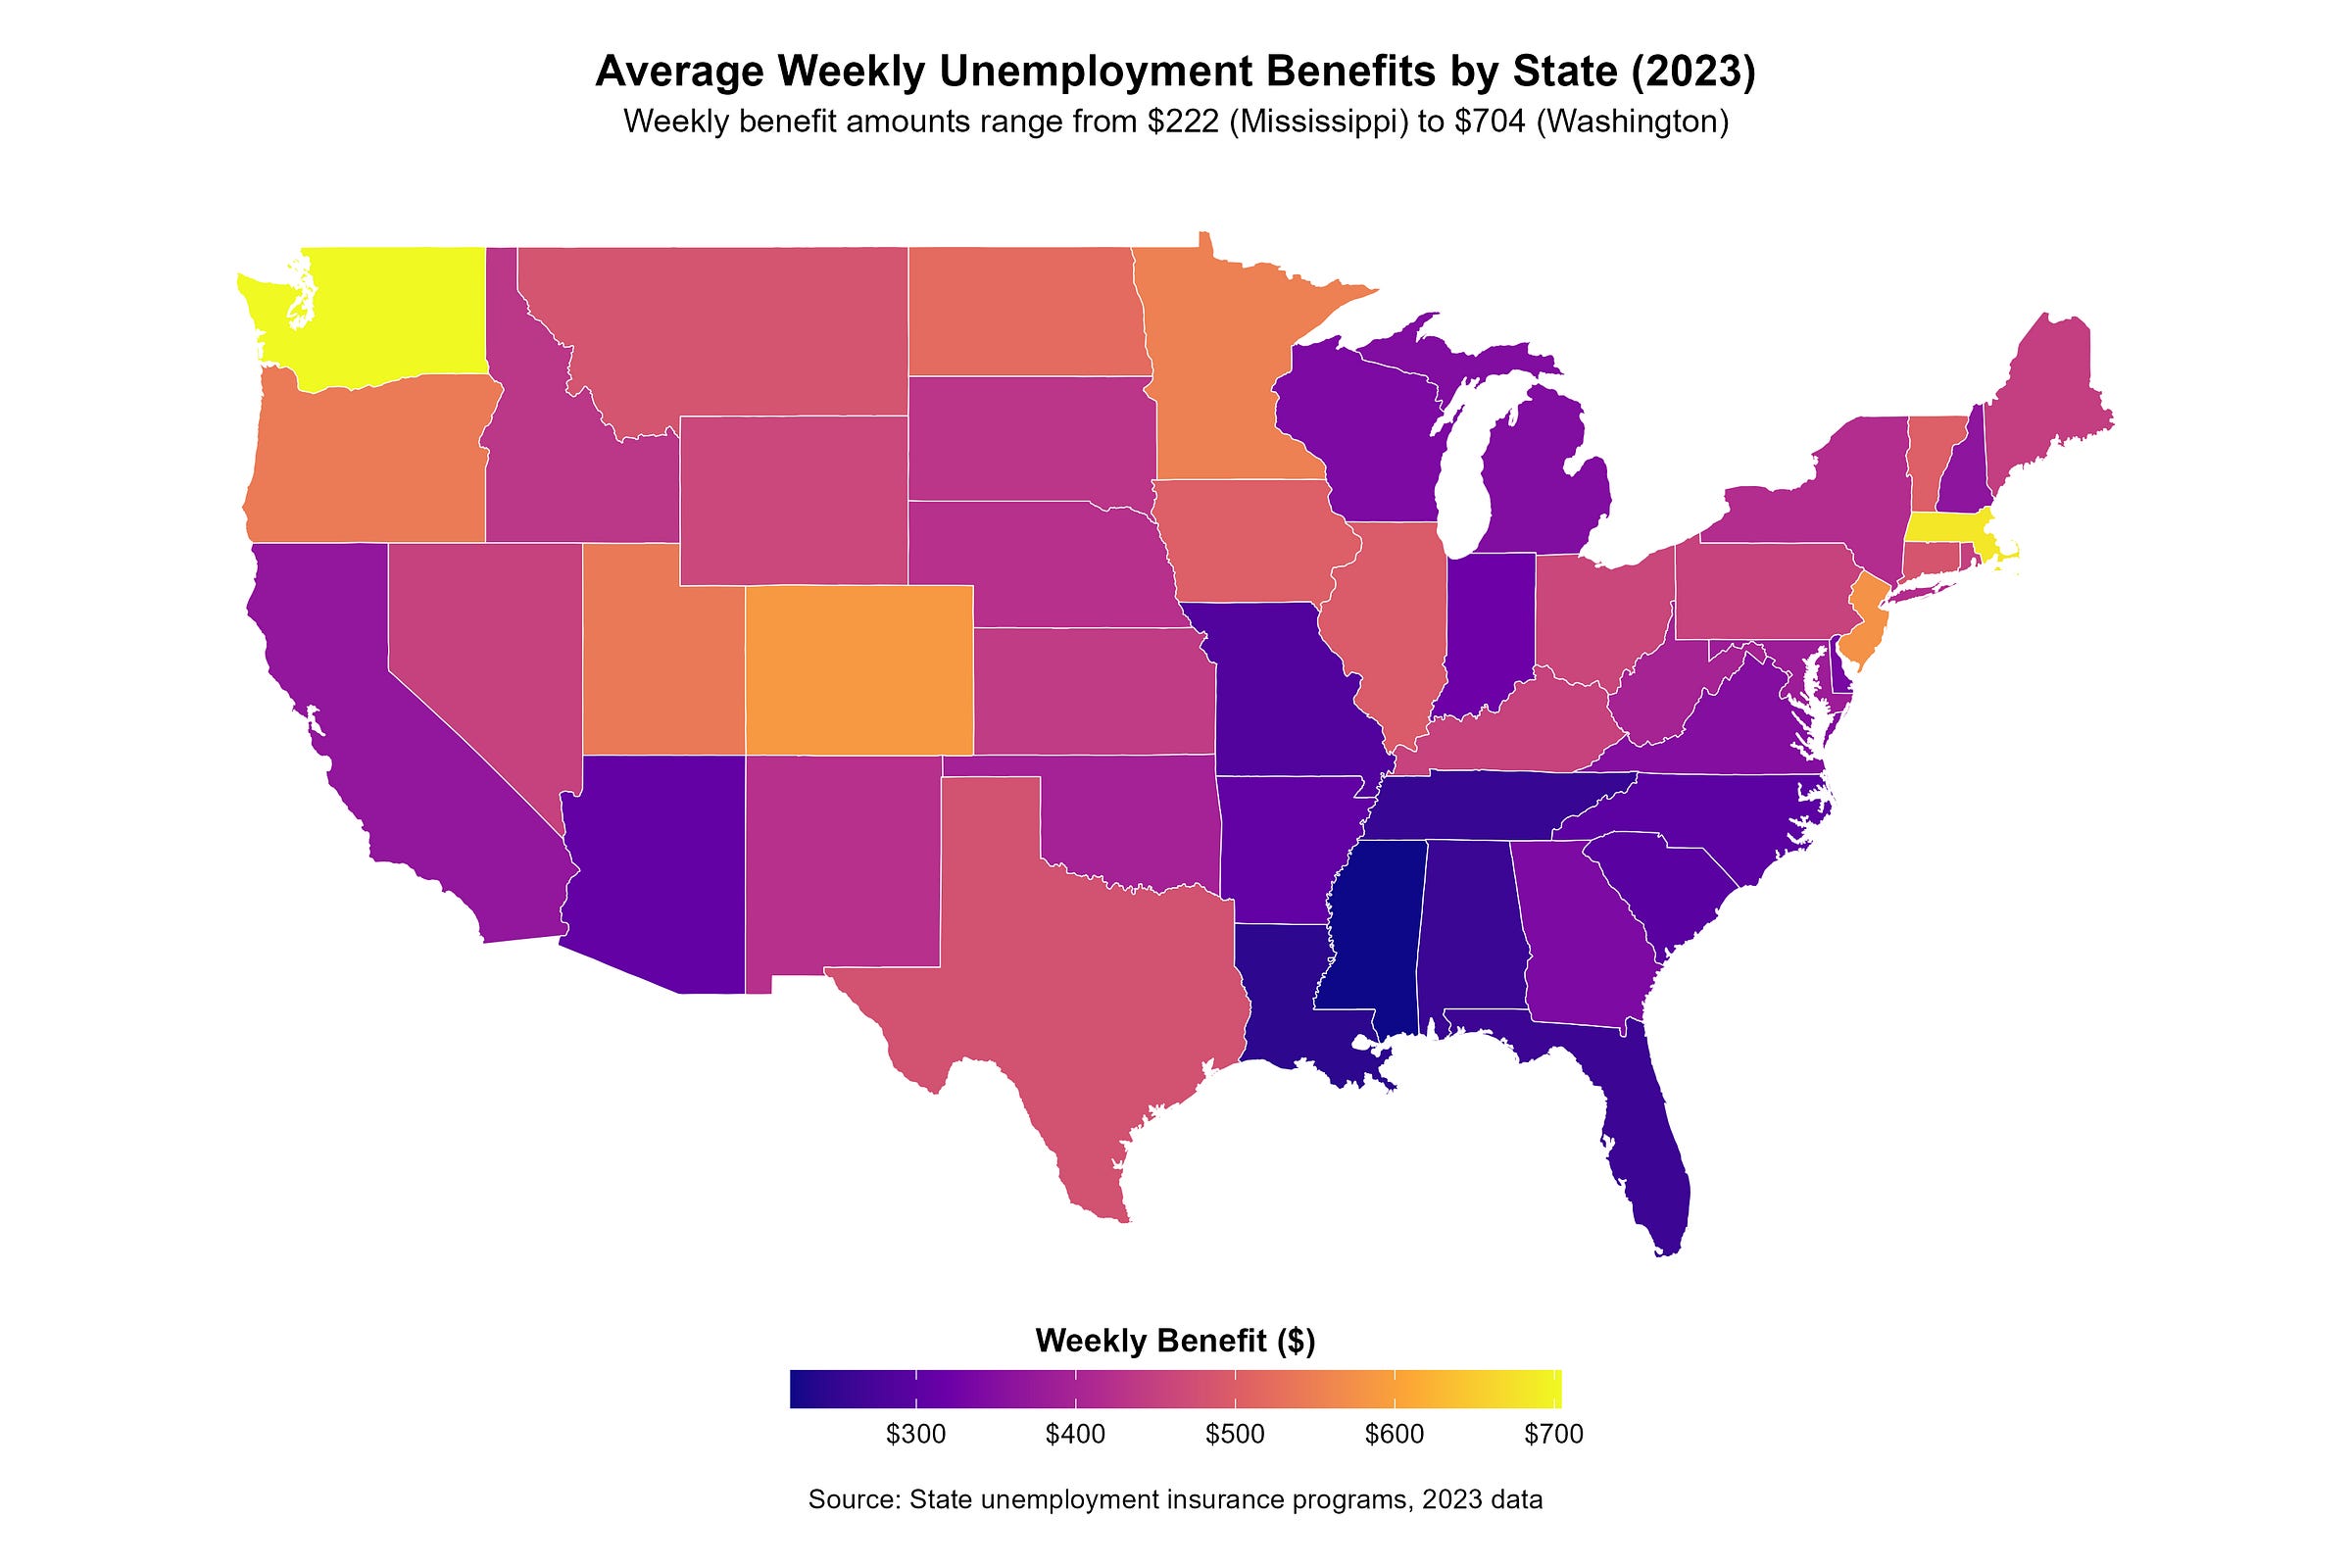
The Massachusetts worker can receive up to $1,051 per week in unemployment benefits. The Mississippi worker's maximum is $235 per week. That's a 340% difference in support for facing the same economic situation.
These disparities show up everywhere: how much you get, how long you get it, and whether you can access benefits at all. Understanding why requires looking beyond the headlines at how 50 different systems actually work in practice.
Want to see how your state stacks up against the others? Check out my interactive unemployment insurance dashboard and tell me what you find in the comments!
The Money: How Much States Actually Pay
When you map maximum weekly unemployment benefits across all 50 states, regional patterns emerge. The range spans from Mississippi's $235 per week to Massachusetts' $1,051, but the distribution isn't random or arbitrary.

The differences become even more pronounced when you factor in benefit duration. While most states offer 26 weeks of benefits, the range spans from just 12 weeks in North Carolina and Florida to 28 weeks in Montana. This creates a compounding effect where both weekly amounts and time limits vary dramatically.
When you calculate total potential benefits over the full period, the disparities are striking: a worker collecting maximum benefits in Massachusetts could receive $27,326 over 26 weeks, while someone in Mississippi would get $6,105 over the same timeframe. For a restaurant manager or retail worker facing a long job search, this difference could determine whether they can afford to find a good match for their skills or must take the first available position.
But the weekly maximums only tell part of the story. Most workers don't receive maximum benefits because unemployment insurance typically replaces a percentage of previous wages up to that state ceiling. This is where replacement rates become crucial for understanding what workers actually experience.
The Access: Who Gets Benefits and How Much
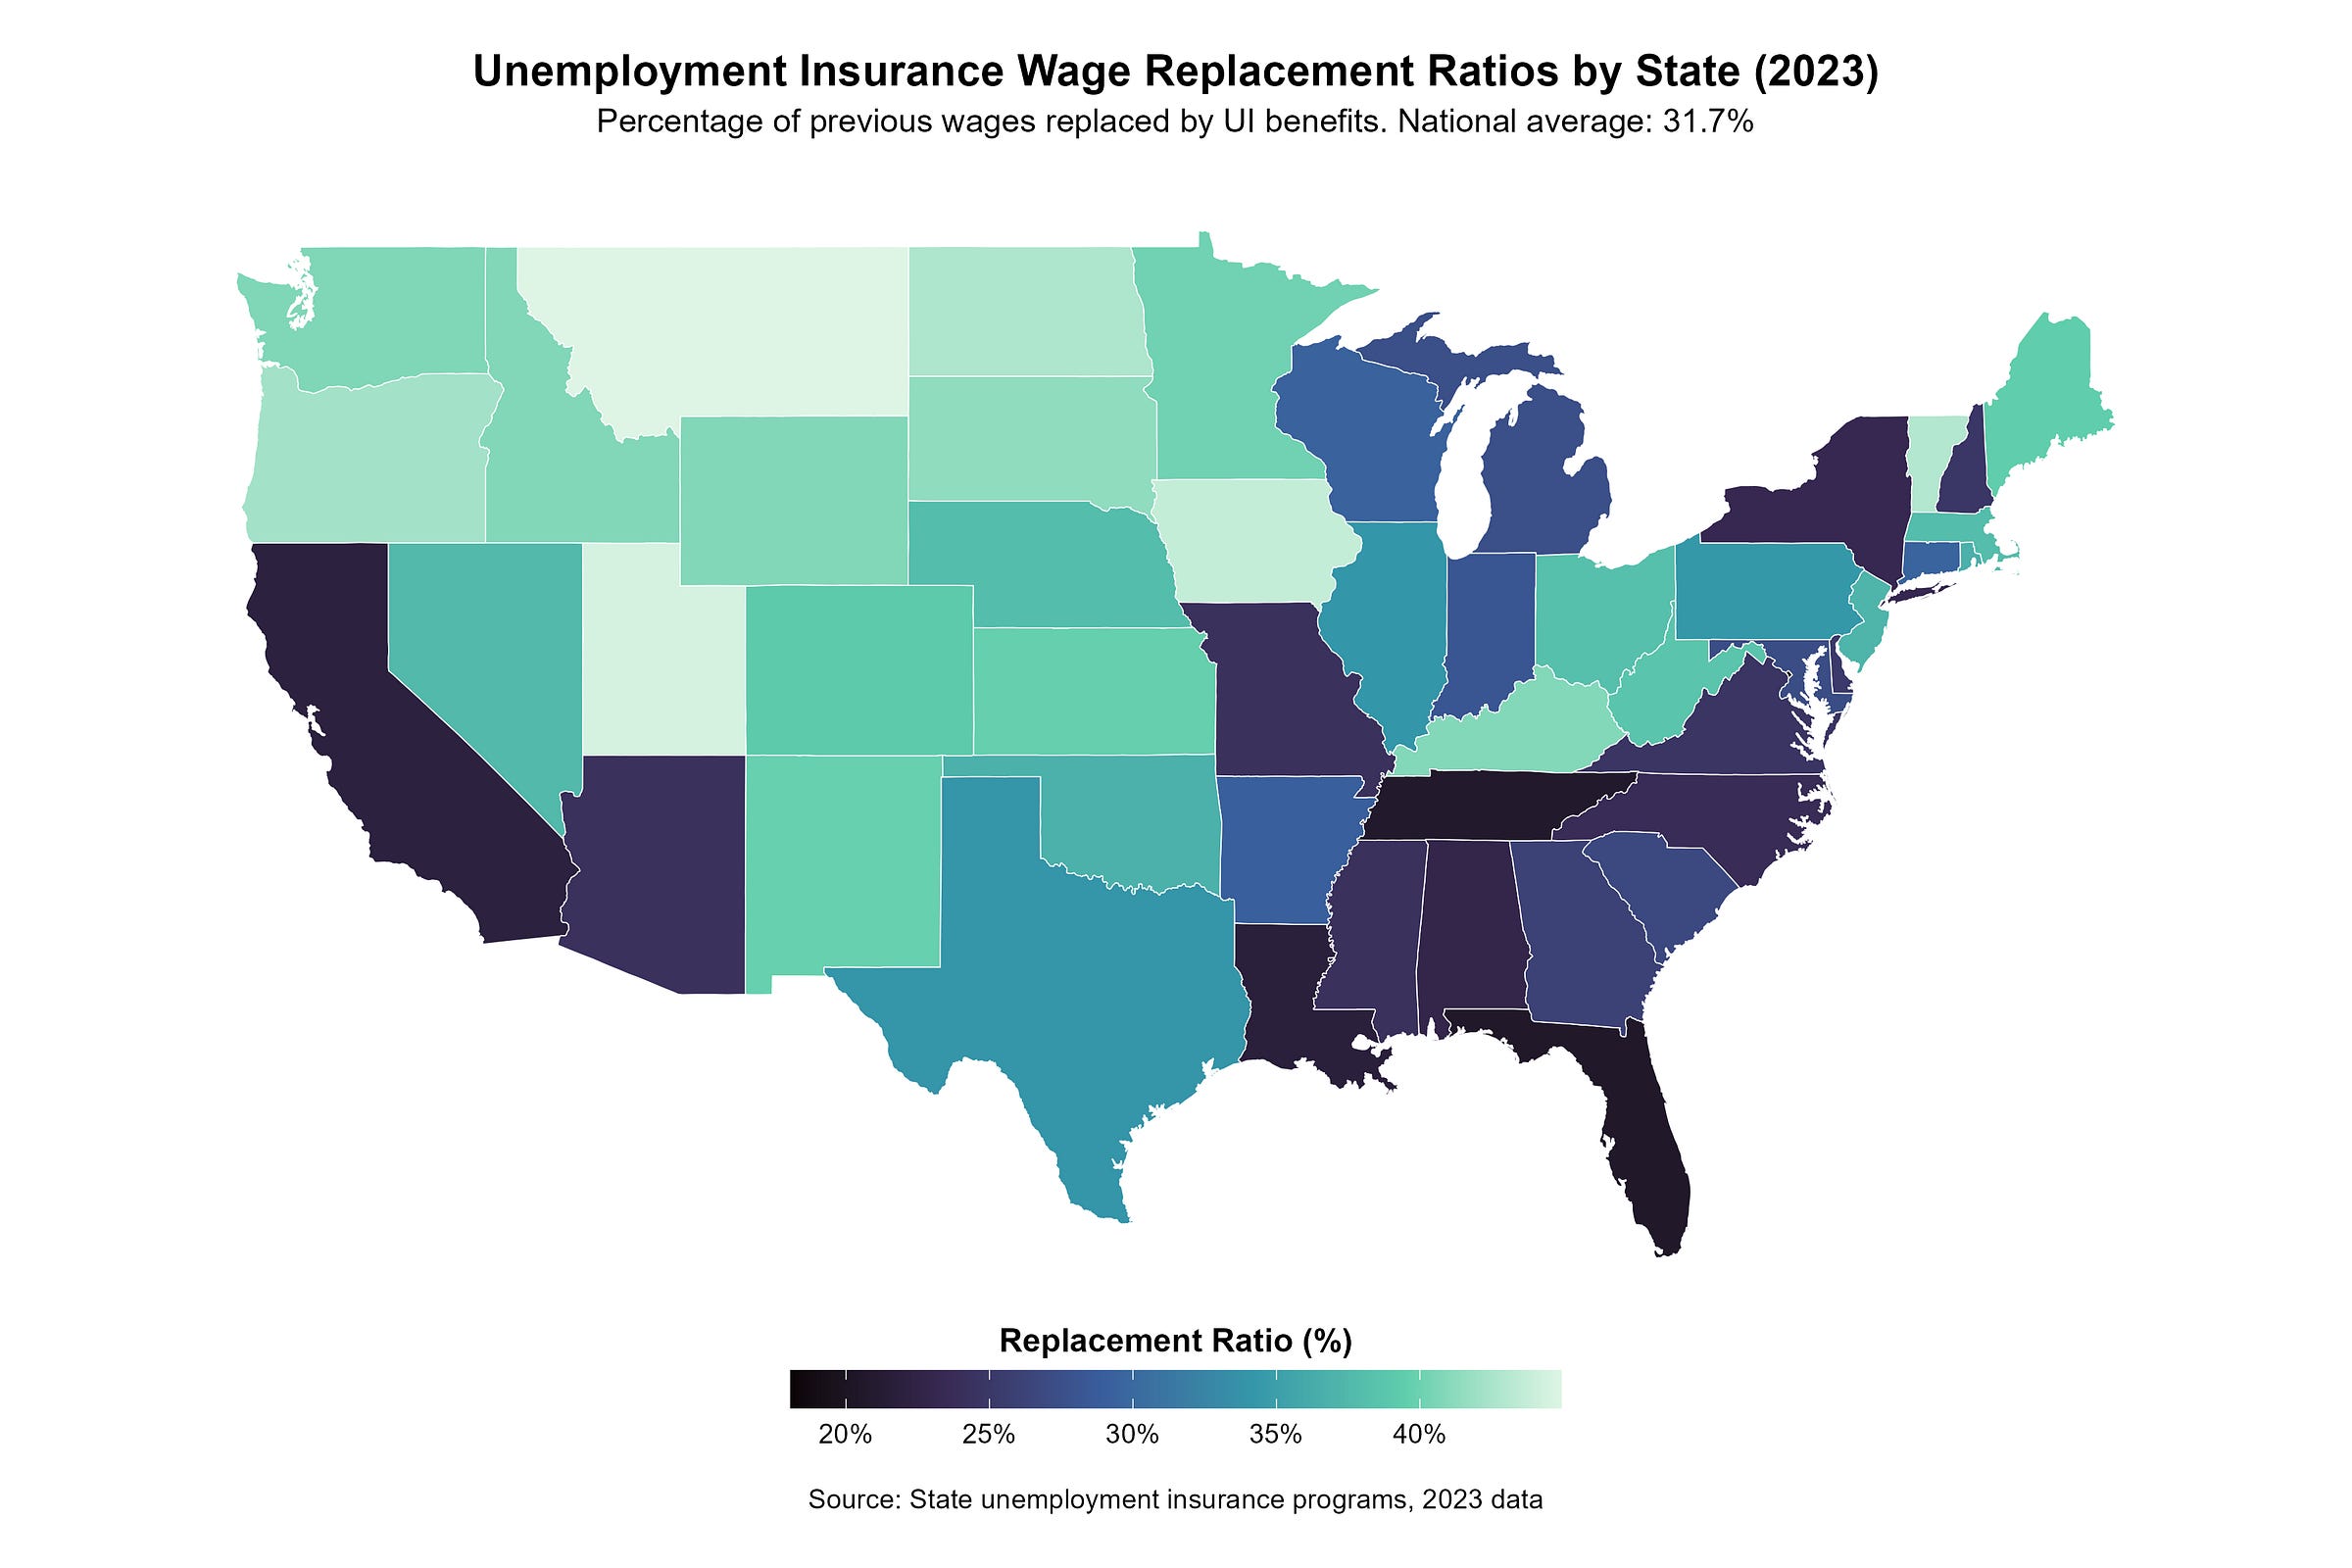
Nationwide in 2023, unemployment benefits replace an average of 32% of workers' previous wages, but this figure masks significant state-by-state variation. Some states structure their formulas to provide higher replacement rates for lower-wage workers, while others maintain relatively flat benefit structures across income levels.
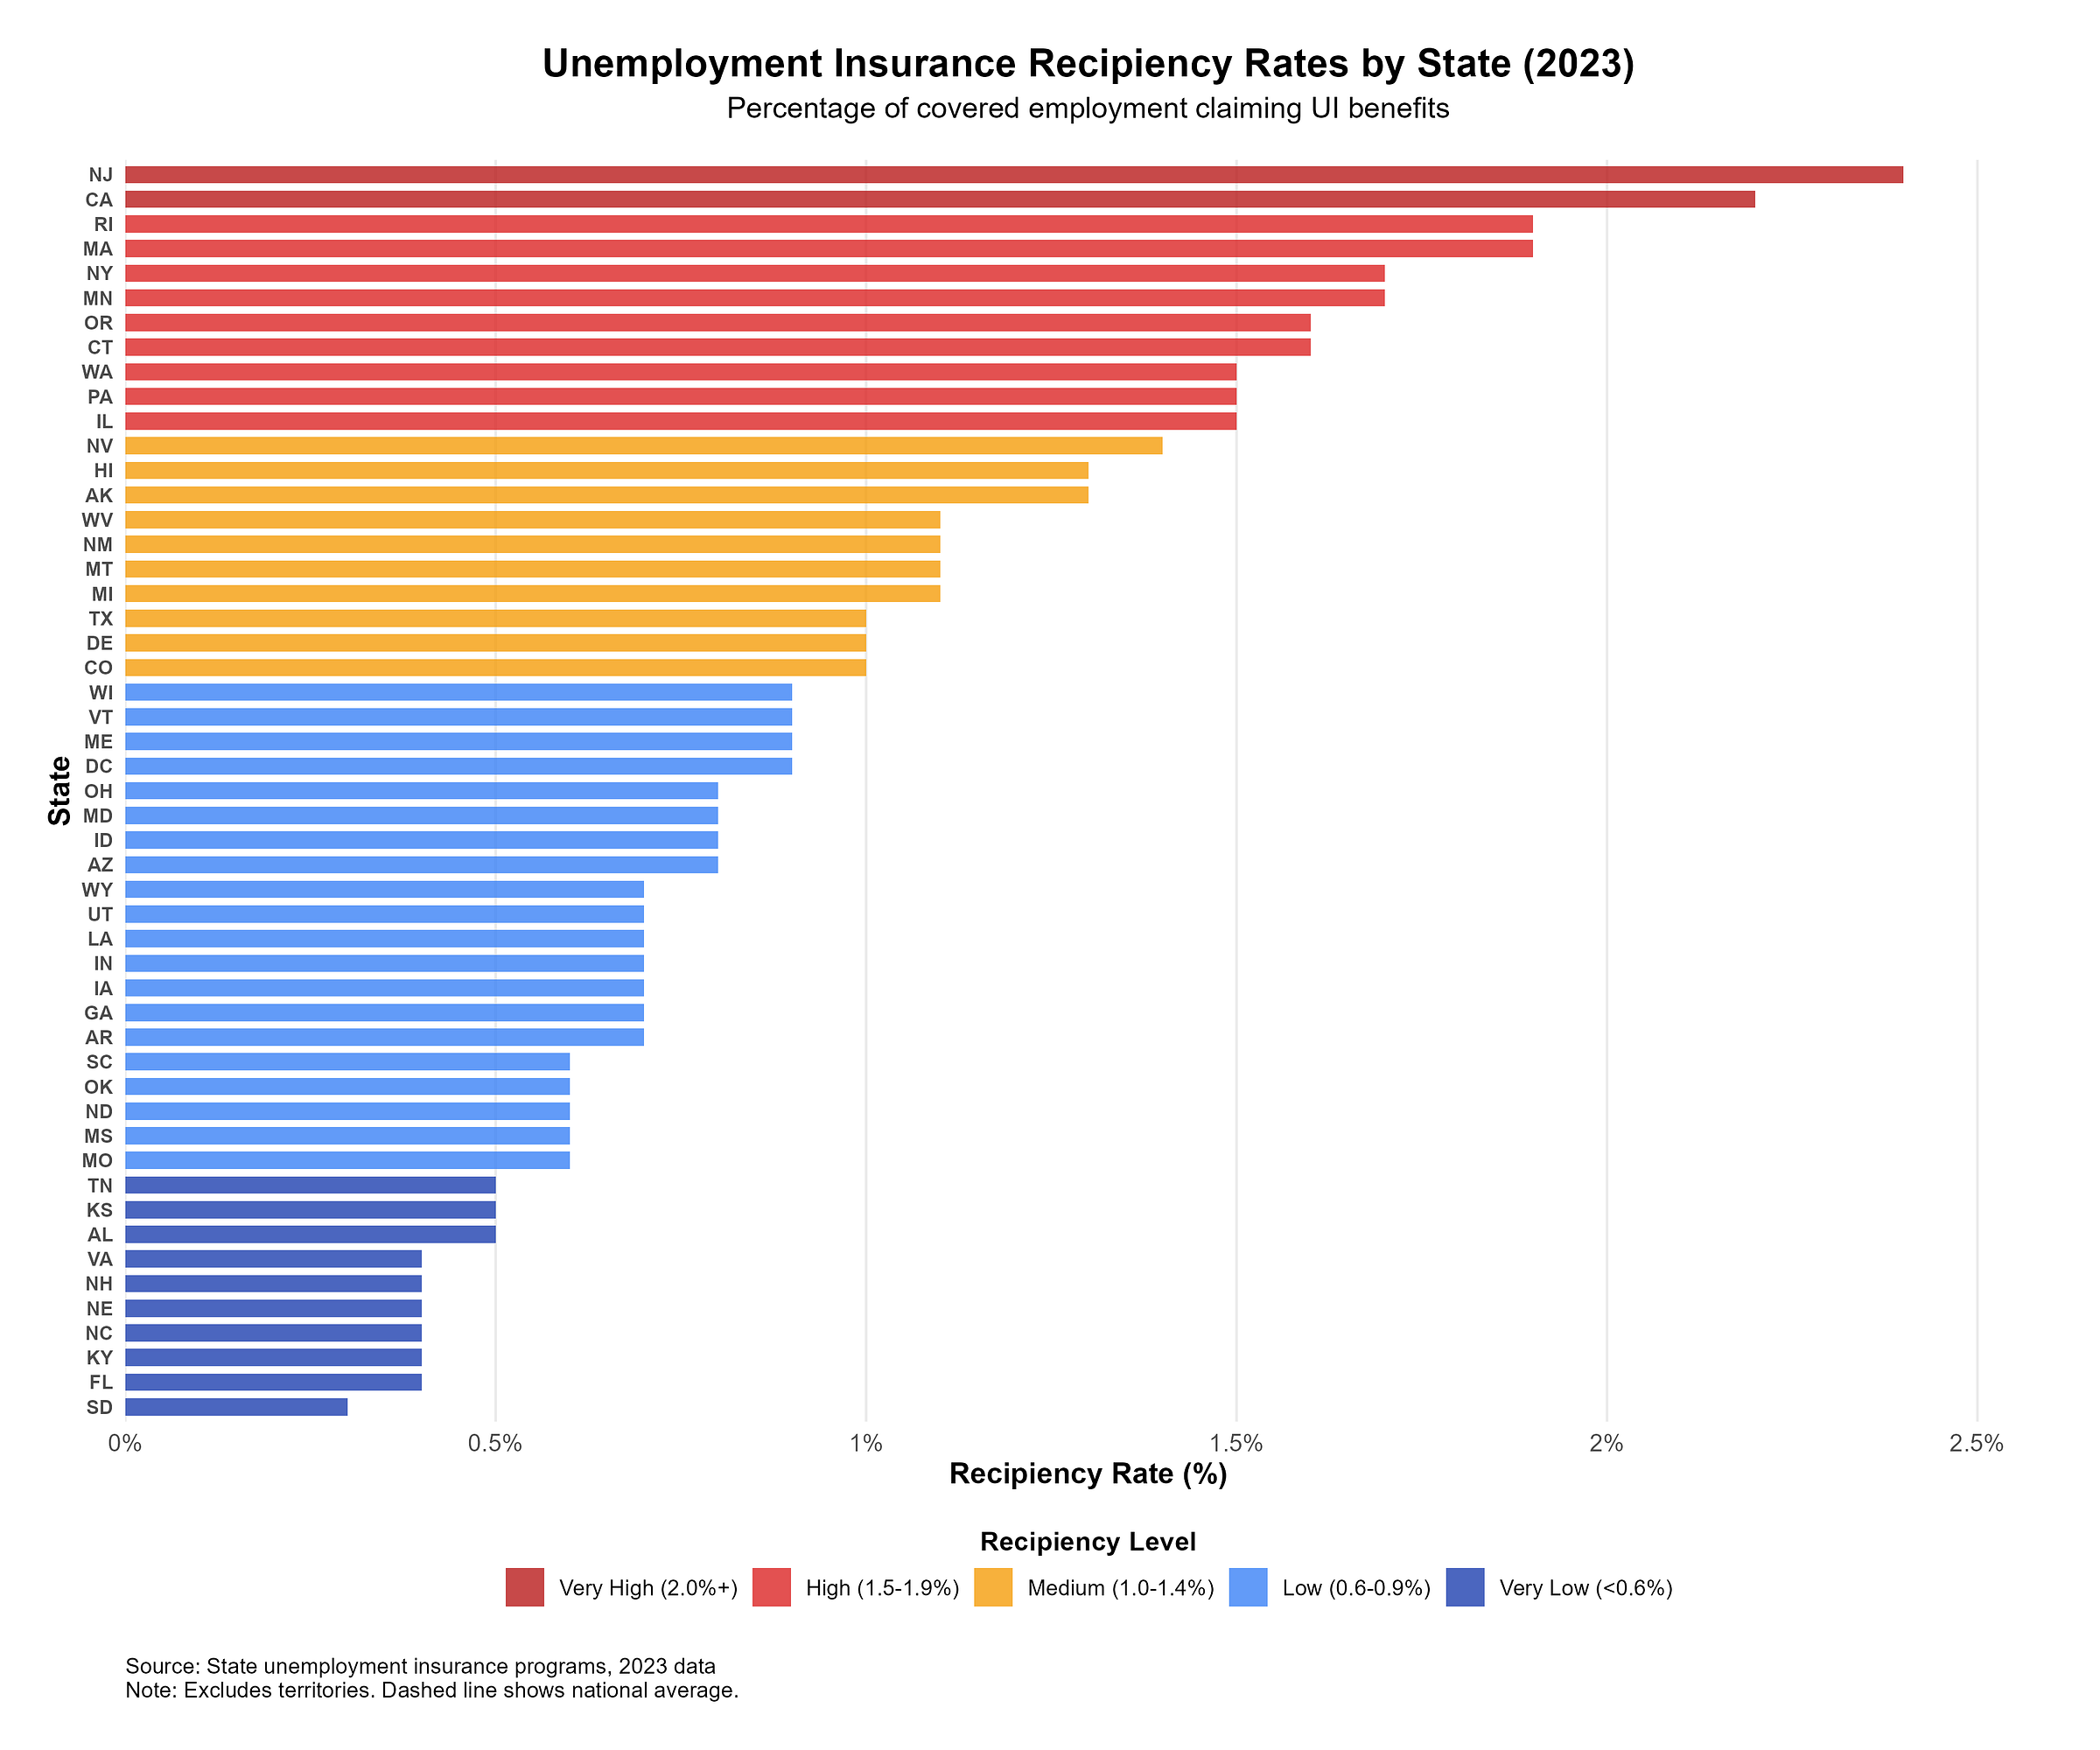
The relationship between benefit generosity and system usage reveals some of the most compelling patterns in the data. When measured as a percentage of total covered employment claiming UI benefits, recipiency rates vary dramatically across states. New Jersey leads with 2.4% of its covered workforce claiming benefits, while California follows at 2.2%. At the other extreme, states like South Dakota see only 0.3% of covered workers accessing unemployment insurance. The national average stands at 1.2%, but this masks enormous variation, with most states clustering between 0.5% and 1.5% of their workforce receiving benefits at any given time.

Federal Reserve Bank of Minneapolis researchers found a clear correlation between these measures: states with higher replacement rates tend to have higher recipiency rates. Specifically, each 1 percentage point increase in replacement rate corresponds with roughly 0.6 percentage point increase in recipiency.
This suggests that benefit levels don't just affect how much support unemployed workers receive, but whether they access the system at all. The data indicates that generosity and accessibility are linked in ways that simple benefit comparisons might miss.

The Design: How 50 Different Systems Work
These variations exist because we don't actually have a single national unemployment insurance program. Instead, we have a federal-state system where Washington sets broad parameters and states design specific implementations within those guidelines.
This structure dates to the 1930s, when policymakers chose to balance federal coordination with state flexibility. States determine employer tax rates, benefit levels, duration, and eligibility criteria within minimal federal requirements. The result is essentially 50 different experiments in unemployment policy running simultaneously.
The variation extends beyond dollar amounts into program architecture that shapes worker experiences in ways that don't show up in headline benefit numbers. Some states require a one-week waiting period before benefits begin, while others have waived this requirement. States also make different choices about eligibility requirements and administrative processes that can significantly impact workers' ability to access support.
Some states opt for higher weekly benefits over shorter periods, while others spread smaller payments over longer timeframes. These represent fundamentally different approaches to managing the same basic challenge: how to provide temporary income support to workers between jobs.

Recent trends show this variation increasing rather than converging. The aftermath of the Great Recession left many state trust funds depleted, leading to different approaches to fiscal recovery. Some states cut benefits to restore solvency, while others maintained or increased support levels. These choices have created diverging trajectories that persist today.
What This Reveals About Policy in Practice
The evidence points to several clear patterns that extend beyond unemployment insurance to broader questions about social policy design.
First, state systems create substantially different experiences for similar workers facing similar circumstances. The data shows that geographic location can be as important as work history or skills in determining the support available during unemployment. A restaurant manager laid off in Massachusetts receives different support than one laid off in Mississippi, affecting their job search timeline, financial stability, and career trajectory.
Second, benefit generosity and system accessibility appear linked in ways that policymakers may not always anticipate. States with more generous benefits tend to see higher participation rates, suggesting that program design affects both the reach and impact of social insurance programs.
Third, these differences have broader economic implications that extend beyond individual workers. States with stronger unemployment systems may provide more effective economic stabilization during downturns, as unemployed workers have more money to spend in their communities. This creates potential spillover effects that influence regional economic resilience.
The variation also creates natural experiments in social policy. When states make different choices about unemployment insurance design, we can observe the results in real time across multiple dimensions: fiscal sustainability, worker outcomes, economic stability, and political sustainability. This provides valuable evidence about which approaches achieve different objectives and what trade-offs emerge in practice.
Rather than a simple story of effective versus ineffective systems, the data reveals complex relationships between program design, state capacity, economic conditions, and political preferences. These patterns offer insights not just about unemployment policy, but about how federalism shapes social insurance more broadly.
In my next post, we'll look at what drives these state-level differences. The patterns in the data suggest that economics, politics, and historical factors all play roles in shaping how states approach unemployment insurance, creating a natural laboratory for understanding social policy choices in practice.
This analysis draws from my interactive unemployment insurance dashboard, which tracks benefit levels, duration, and more across all 50 states.
Sources and Methodology: State-level data accessed through the Department of Labor’s UI Data Portal (ETA Handbook 394)


