
Proposition 409 Analysis
Property Tax Increase in Maricopa County, Arizona

Maricopa County voters will decide on Proposition 409 this November—a $900 million bond to fund “additional inpatient and observation beds, replace outdated clinics, and rebuild key facilities like the Comprehensive Health Center – Phoenix and the Behavioral Health Annex”. The question everyone asks: what does this actually cost me?
I’ve seen signs telling voters “Reject the tax increase!” or “Prop 409: A Massive Tax Hike”. I think those sorts of signs are incredibly misleading and don’t let voters make informed decisions on what they’re voting for or against. I’m not going to take a stance on this proposition here, but I wanted to make it clear how small of a tax increase this proposition would actually trigger.
The Yes on Prop 409 website walks those interested in figuring out how much it will cost you if the proposition passes. It gives an estimate of “11 cents per $100 of net Assessed Limited Property Value”, but I don’t know anyone who knows that number off the top of their head or even how to find it. So I pulled Zillow estimates and calculated tax increases for 20 real Maricopa County homes to make it easier.
Check out my interactive calculator here! If you want to see additional analysis of any state or local bills you will be voting on, let me know in the comments!
The Bottom Line
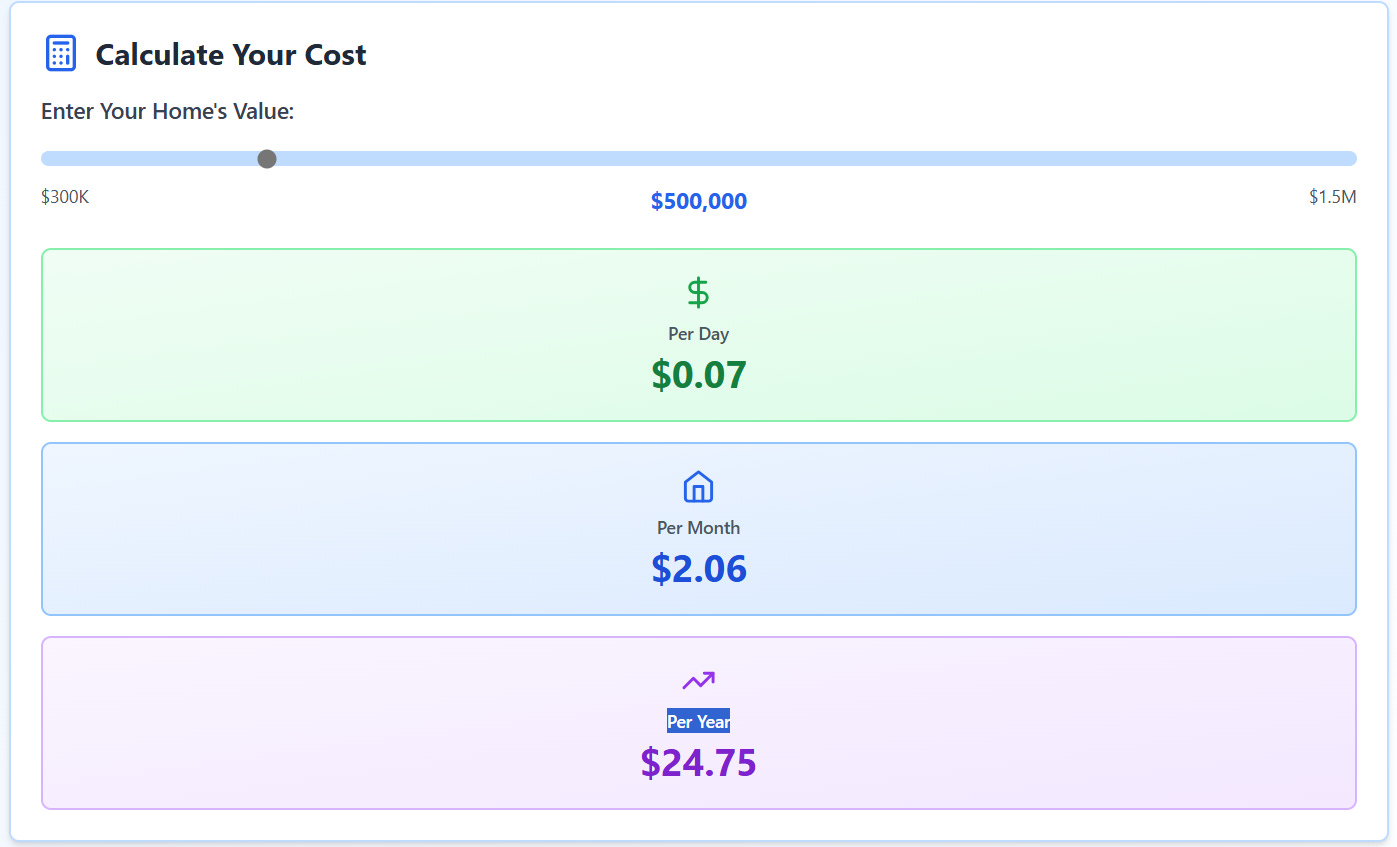
For a median-priced home in Maricopa County around $500,000, Proposition 409 will cost approximately $2.00 per month. That’s $24 annually, or about 7 cents per day. The relationship is remarkably linear: roughly $0.05 per $1,000 of home value each year. While this isn’t a negligible amount, it is a fairly small amount of money that will fund services that some may find essential.
What I Found
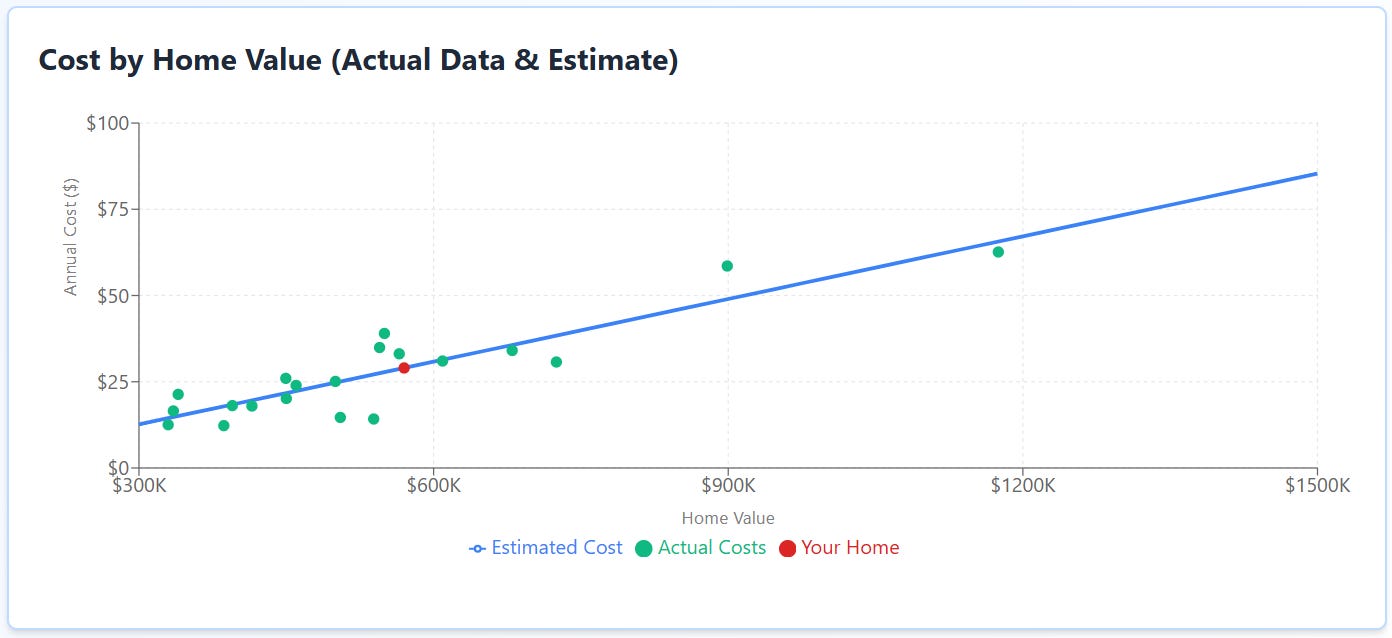
I analyzed 20 homes ranging from $329,700 to $1.175 million. The annual tax increase ranged from $12.28 to $62.62. When I ran a regression on the data, here’s what different home values can expect:
$400K home: ~$19/year ($1.56/month)
$500K home: ~$25/year ($2.06/month)
$600K home: ~$31/year ($2.57/month)
$1M home: ~$55/year ($4.59/month)
Even at the high end of my sample ($1.175M home), the annual increase was just $62.62, or about $5 per month.
Why This Matters
Property tax increases sound scary in the abstract. “$900 million bond” sounds massive. But when you break it down to what individual homeowners actually pay, the picture changes completely.
The average homeowner will pay less for this entire year than they spend on a single streaming service subscription. And in return, Maricopa County gets $900 million in funding for community health services.
That’s the kind of cost-benefit calculation voters need to see, regardless of your view on the proposition. We need informed decision making, not decisions based on provocative roadside signs!
Try It Yourself
I built an interactive calculator where you can enter your home’s value and see your estimated cost broken down by day, month, and year. The tool shows both the actual data points from real homes and a smoothed estimate curve.
The math is simple. The impact on your wallet is minimal. The benefit to the county could be substantial. Vote how you want with this information!
Technical Note: Analysis based on 20 Maricopa County residences with Zillow home estimates ranging from $329,700 to $1,175,000. Tax increases calculated using bond assessment methodology. Linear regression used to generate cost estimates across home values. Individual costs may vary based on property assessment, exemptions, and specific location within Maricopa County.