

A few weeks ago I introduced the 287(g) adoption risk calculator, built on the published Cox proportional hazards model from my Public Administration Quarterly paper. The core question the tool answers: which counties are most likely to sign a 287(g) agreement with ICE, and why?
The calculator has been updated in three meaningful ways since the first post, and this one walks through all three, then uses Coconino County, Arizona as a full case study for the new Local Impacts feature.
What’s New
The map now shows ban-state counties. Nine states have enacted laws that prohibit localities from signing 287(g) agreements with ICE: California, Illinois, Oregon, Washington, New Jersey, and Colorado, joined by New Mexico, Maine, and Maryland in 2025. These counties now appear in green on the map. The distinction matters. A county showing no risk score because it’s in a ban state is a very different situation than a county showing no score because it hasn’t been modeled. The map now makes that clear.
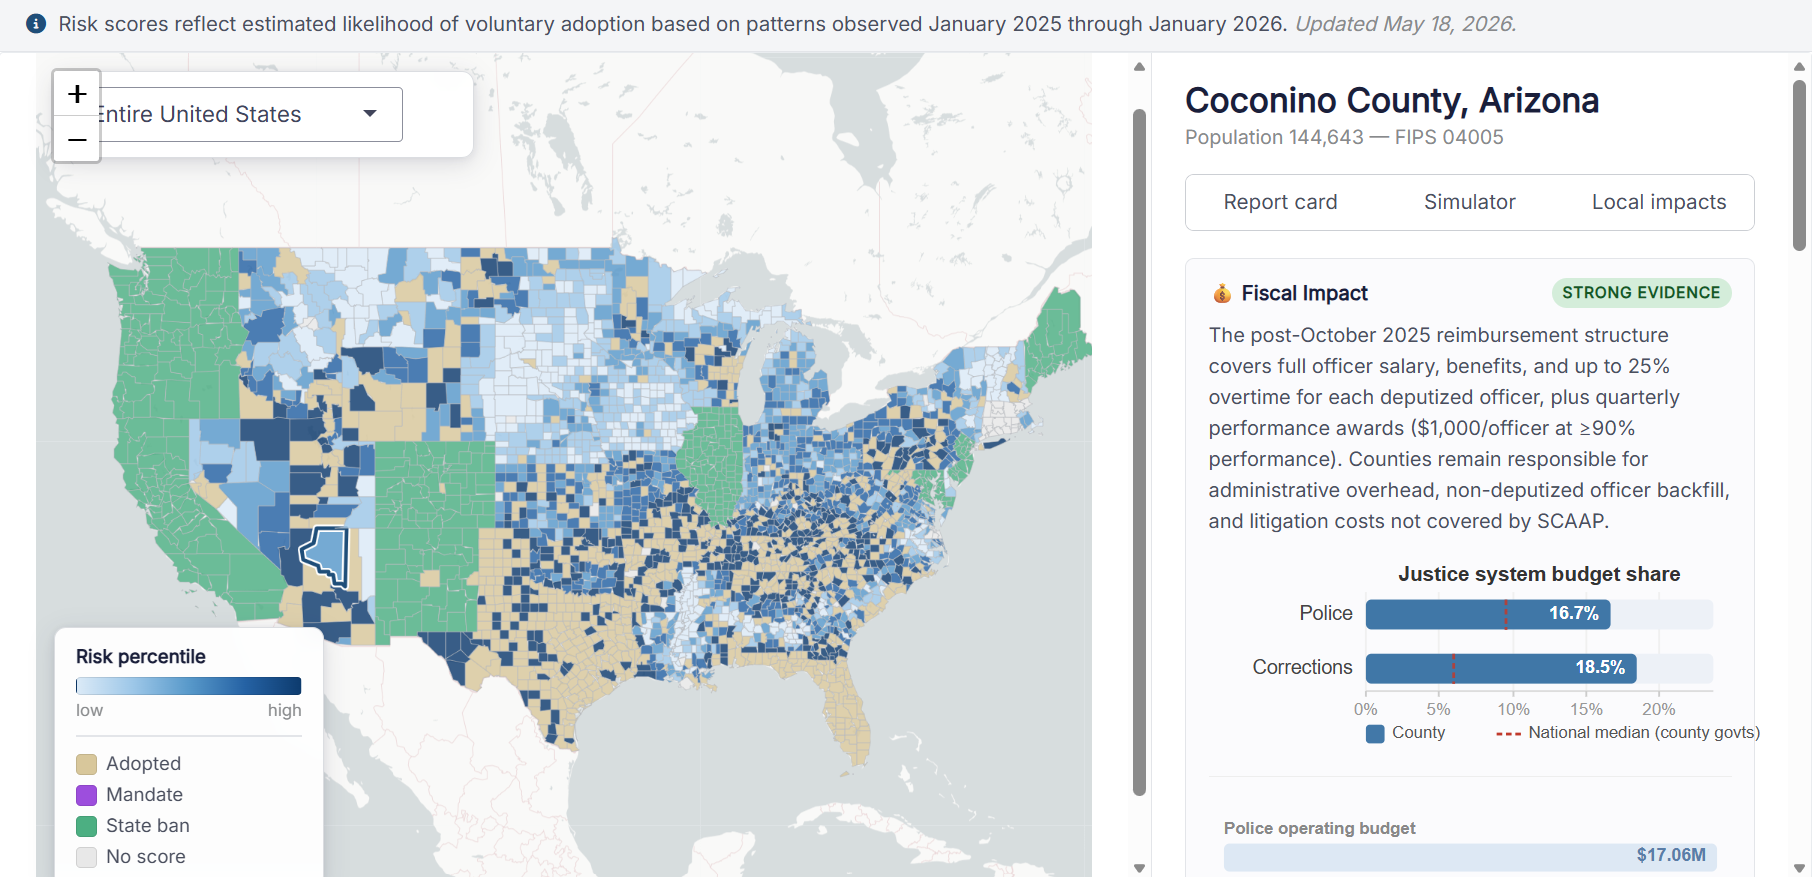
A third tab: Local Impacts. The original calculator gave you two views for any non-adopting county: the Report Card (risk percentile, driver breakdown, neighbor status) and the Simulator (what-if adjustments to key covariates). The updated version adds a Local Impacts tab that translates the risk score into decision-relevant consequences. More on this below.
The fiscal card is now connected to real spending data. This is the most substantive update. The Local Impacts fiscal card now pulls directly from Census of Governments function-level expenditure data, showing what a county actually spends on police protection, corrections, and courts, benchmarked against national county-government medians, and generates a county-specific reimbursement estimate under the 2025 DHS compensation structure.
Coconino County, Arizona
Coconino is an interesting case to walk through. It is the second-largest county in the United States by area: 18,600 square miles, containing the Grand Canyon, the Navajo Nation, the Hopi Reservation, and Flagstaff, home to Northern Arizona University. Population 144,643.
Its risk percentile sits at 57th among all non-adopting U.S. counties, placing it squarely in the middle of the national distribution. Of its 6 bordering counties, 3 have already adopted: Yavapai, Arizona (June 2020), Navajo, Arizona (April 2025), and Kane, Utah (July 2025). Arizona as a whole sits at 6 of 15 counties adopted, 40%.
What makes Coconino worth examining in detail is the gap between what the structural risk score captures and what the local picture actually looks like. That gap is what the Local Impacts tab is designed to surface.
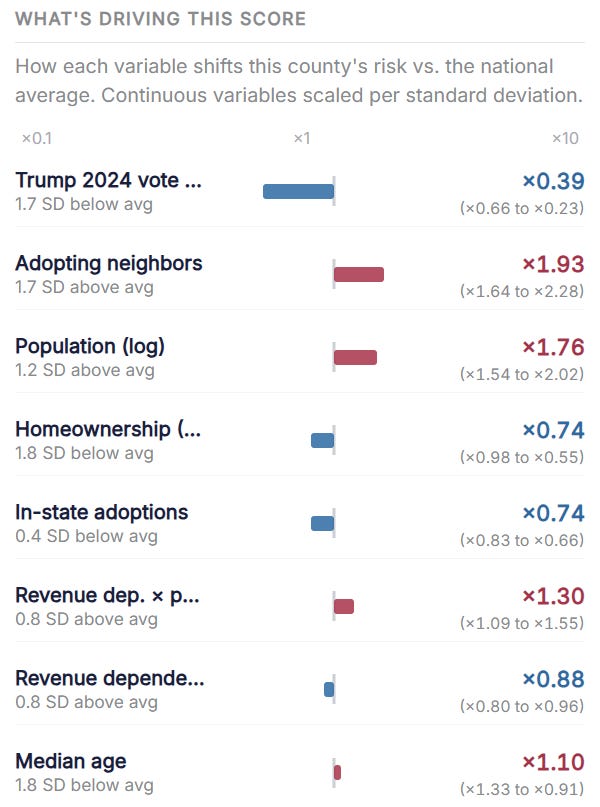
The driver decomposition tells a clear story about why the score lands at 57 and not higher. Two variables are pulling hard in opposite directions. Adopting neighbors multiplies Coconino’s baseline hazard by 1.93x, the strongest single risk driver in the county’s profile, reflecting those three bordering adoptions. Population size adds another 1.76x, consistent with larger counties generating more adoption activity. Against those, Trump 2024 vote share cuts risk by 61% (×0.39), reflecting Coconino’s political composition as a county containing a major university and substantial Indigenous populations. Homeownership and in-state adoption rates each apply an additional ×0.74 suppression. The net result is a county where geographic contagion and size are pushing toward adoption, and political alignment and community composition are pushing against it.
Walking Through the Local Impacts Tab
The tab has four cards, each covering a distinct evidence domain. Every card carries an explicit evidence-quality label: Strong, Mixed, or Contested. That label is not aesthetic. It reflects the actual state of the peer-reviewed literature, and it matters for how you interpret what you’re reading.
Fiscal Impact — Strong Evidence
This is where the most county-specific information lives, because it connects directly to real Census of Governments data.
Coconino County spends $17.06 million annually on police protection operations, representing 16.7% of its general operating budget, above the national county-government median of approximately 9.5%. Corrections and detention operations account for another 18.5% of the operating budget.
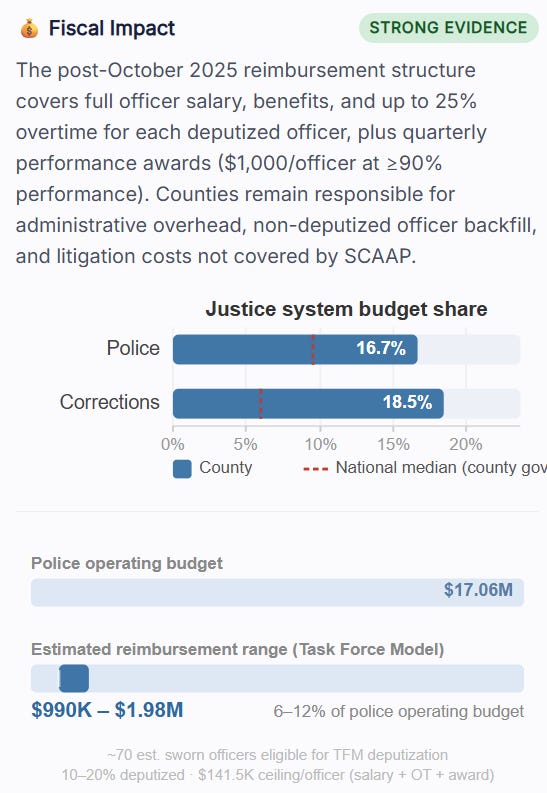
The reimbursement estimate requires some transparency about methodology. The app estimates sworn officers accounting for the fact that that budget covers civilian staff, dispatch, admin, and overhead in addition to sworn deputies. Dividing by the $110,000 national median total officer compensation yields approximately 70 estimated sworn officers eligible for Task Force Model deputization, a figure consistent with what LEOKA data shows for similarly-sized county sheriff’s offices. Deputizing 10 to 20% of those officers generates an estimated $990K to $1.98M annually in federal reimbursements under the 2025 DHS compensation structure, representing 6 to 12% of Coconino’s police operating budget.
That range is specific to the Task Force Model, which is the only 287(g) model with full salary reimbursement under the October 2025 structure. A Jail Enforcement Model adoption would look different: corrections officer costs partially offset by SCAAP, with no comparable direct salary reimbursement.
Whether the reimbursement fully offsets participation costs depends on implementation scope. Administrative overhead, non-deputized officer backfill, and litigation exposure are not covered.
Coconino has above-average revenue dependency, as the driver decomposition confirms. That means this reimbursement offer does not land on a fiscally indifferent county. A county that already relies on intergovernmental transfers has demonstrated sensitivity to federal funding signals, and the 2025 structure is a significant one. The fiscal calculus is not neutral here.
Crime and Public Safety — Mixed Evidence
The public safety rationale is the most commonly cited justification for 287(g) adoption. It is also the one with the weakest empirical support.
The most rigorous peer-reviewed studies find no significant effect of 287(g) on overall county crime rates. A North Carolina county analysis (2010) and a national county-level study (2014, Journal of Quantitative Criminology) both find null effects on violent and property crime after controlling for relevant covariates. The crime reduction argument has not survived careful empirical scrutiny.
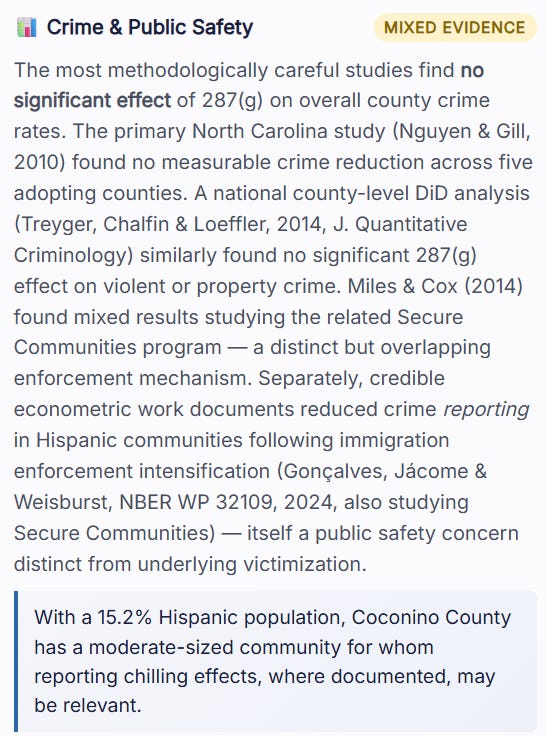
What has survived is a separate and distinct finding: evidence of reduced crime reporting in communities with significant immigrant populations following immigration enforcement intensification. The most rigorous work here (NBER Working Paper, 2024), documents a 30% decline in crime reporting among Hispanic victims and a 16% increase in victimization following enforcement expansion under the related Secure Communities program. The mechanism is straightforward: when victims fear law enforcement contact, crimes go unreported, offenders face lower arrest probability, and victimization rises.
That is a public safety problem.
For Coconino specifically, this is where the county’s demographic profile complicates the standard framework. The existing research on immigration enforcement and crime reporting focuses almost entirely on Hispanic communities. Coconino’s largest minority populations are Indigenous. The Navajo Nation and Hopi Reservation account for a substantial share of the county’s geography and population.
Community Trust — Mixed Evidence
This is the most consistently documented consequence across the literature. Multiple independent research streams find increased fear of law enforcement among immigrant residents following 287(g) adoption, with downstream effects on public safety cooperation, health service utilization, and school enrollment. Amada Armenta’s ethnographic work in Davidson County, Tennessee, and the Nguyen and Gill North Carolina findings both document this pattern. The DOJ’s pattern-or-practice findings in Maricopa County (December 2011) and Alamance County (September 2012) are the two most prominent federal findings of systematic discrimination under 287(g) authority.
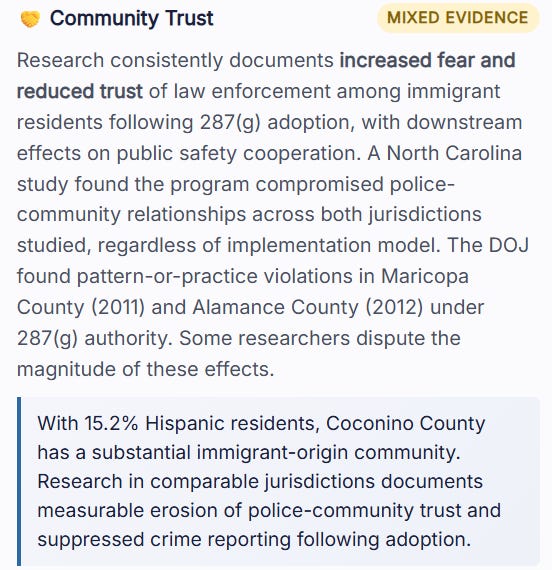
The specific mechanism worth understanding: community trust effects are not limited to undocumented residents. Research consistently finds that fear extends to documented immigrants, naturalized citizens, and U.S.-born members of communities with significant immigrant-origin populations. The chilling effect is communal, not individual.
For Coconino, the tribal sovereignty dimension adds a layer the national evidence base does not address. The Navajo Nation and Hopi Reservation are sovereign governments with their own law enforcement agencies and complex jurisdictional arrangements with the county. A 287(g) agreement signed by the Coconino County Sheriff would operate in that context. The operational and intergovernmental implications of that context are not captured by any national model.
Legal and Liability Exposure — Mixed Evidence
Local agencies assume direct legal liability for officer actions under 287(g) agreements. The documented liability categories are Fourth Amendment violations for detainers held without judicial warrants, wrongful detention of U.S. citizens, and racial profiling claims. Roy v. County of Los Angeles, settled in 2020 for $14 million, covered more than 18,500 people held on ICE detainer requests. That settlement represented direct financial liability to the county, not federal reimbursement.
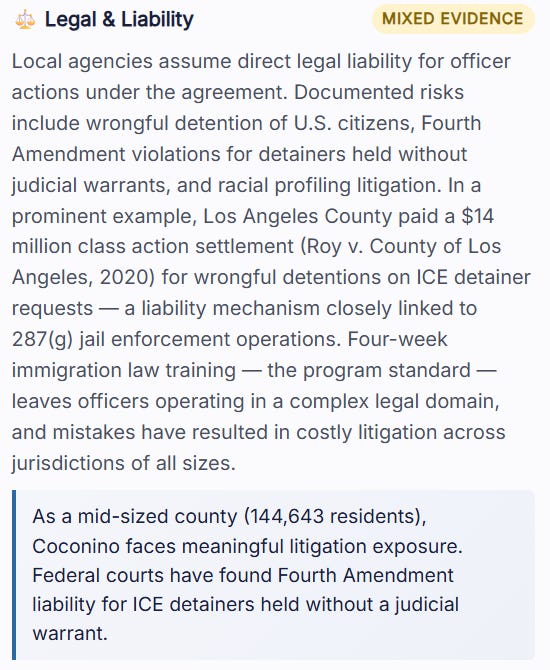
The four-week immigration law training that is the program standard leaves deputized officers operating in a complex legal domain. In Coconino’s case, that domain intersects with tribal sovereignty, federal land management jurisdiction, and existing Navajo and Hopi law enforcement arrangements. That complexity does not make adoption impossible. It does mean the operational picture is more involved than a standard rural county adoption.
For a county with an estimated 155 officers, litigation exposure scales with the number of detainer interactions, which scales with the volume and scope of program implementation.
What the Risk Score Doesn’t See
The structural risk score is built on variables that predict adoption across the national cross-section of counties: neighbor contagion, fiscal structure, political alignment, population size, Hispanic share, college attainment. It is well-calibrated to capture the forces that move a county toward signing.
It does not see tribal sovereignty. It does not see intergovernmental jurisdictional complexity. It does not see the specific political dynamics of a county seat that is a university town in a state with heavy adoption pressure. The Local Impacts tab does not solve those gaps entirely, but it narrows them. The fiscal numbers are real. The research citations are documented. The evidence-quality labels are honest.
The combination of structural risk score, evidence-grounded consequence data, and locally specific context is what the updated tool is designed to provide.
Use the Tool
Search your county. Check the risk percentile and driver breakdown on the Report Card. Then open the Local Impacts tab and look at what adoption would actually mean for your county’s fiscal position, its public safety landscape, its community relationships, and its legal exposure. Those are four separate questions that the risk score alone does not answer.
Most counties facing adoption pressure are not asking any of them systematically. That is what this is for.
If you have any suggestions or recommendations for making this calculator better, let me know!