

The Supplemental Nutrition Assistance Program (SNAP) is the nation’s largest nutrition assistance program, serving tens of millions of low-income Americans every year. In fiscal 2023, SNAP helped an average of 42.1 million people per month (about 12.6% of U.S. residents) at a total cost of roughly $112.8 billion. That’s about 1 in 8 Americans getting SNAP each month. By comparison, SNAP accounted for about 68% of all USDA nutrition assistance spending in FY2023. The program is jointly run by USDA and state agencies: most households that qualify receive a monthly benefit on an Electronic Benefits Transfer (EBT) card to buy groceries. Below we look at who receives SNAP (demographics, incomes, family size), how benefits are set, how participation varies across states and counties, and what research says about SNAP’s broader effects on health, the economy, and communities.
If you want a more comprehensive view of SNAP program data, check out this dashboard!
Who SNAP Serves
SNAP is targeted to very low-income households, and many recipients are children, seniors, or people with disabilities. In FY2023 about 40.1 million people lived in SNAP households each month (in 21.4 million households). Most SNAP households include at least one vulnerable individual: roughly 79% of SNAP households had a child, an elderly person (60+), or a non-elderly person with a disability. In fact, 39% of all SNAP participants were children, 20% were seniors, and 10% were non-elderly people with disabilities. Among households with children, the heads of household are often single parents; for example, over half of SNAP households with children are led by a single adult. Altogether, SNAP really is a program for the poor and vulnerable in our communities.

Key points about SNAP household profiles (FY2023):
Household size: The average SNAP household had about 1.9 people, but households with children averaged 3.3 people (households without kids averaged only 1.1).
Income: Nearly 73% of SNAP households had gross monthly income at or below 100% of the Federal Poverty Line. Over one-third (35%) had income at 50% of poverty or below, and these very-low-income households receive 51% of all SNAP benefits. (By contrast, only 27% of SNAP households are above poverty, and they receive just 14% of benefits.).
Earnings and benefits: In FY2022 about 26% of SNAP households had earnings from work (50% among those with children). More commonly, households rely on other supports: about 62% receive unearned income such as Social Security, SSI, or TANF. Indeed, 33% of SNAP households received Social Security (averaging $1,096/month) and 23% got SSI. Only a few SNAP households (~3–4%) receive cash welfare (TANF or General Assistance). About one in five SNAP households have no income of any kind at the time of survey.
Composition: Over half of SNAP households with children (62%) are headed by a single parent (often a single mother). The rest of families with children tend to be larger or multigenerational. Childless SNAP households are often single adults (with or without disabilities).
In short, SNAP households are overwhelmingly poor and often include children or other vulnerable members. The program is designed so that those with the lowest incomes get the largest benefits. For example, households at 50% of poverty receive on average a much larger per-person SNAP benefit than those near the poverty line. This progressive design means SNAP may not lift everyone out of poverty, but it greatly reduces deep poverty. (Indeed, one study estimated SNAP benefits keep about 6.6 million people above the poverty line each year.)
SNAP Benefit Levels and Calculations
How much does SNAP actually pay out to each household? Benefits are based on household size and net income. USDA publishes a maximum allotment table by household size (e.g. a 4-person household’s max benefit was $975/month in 2024), and then each family’s benefit is roughly “maximum allotment minus 30% of net income”. For example, a 4-person family with $1,056 net monthly income would have 30% of that ($317) subtracted from the $975 max, yielding about $658/month in SNAP benefits. (That simple rule – the family must spend about 30% of its net income on food – underlies most SNAP benefit calculations.)
On average, SNAP benefits are modest but meaningful. In FY2023 the average monthly SNAP household benefit was about $332 (excluding pandemic emergency allotments). That works out to roughly $177 per person based on 1.9 people per household. USDA researchers report a similar figure: roughly $212 per person per month across the program in FY2023 (the small difference reflects slightly different data sources and that most SNAP recipients have low or no income beyond the program). In practice, benefits vary by household type. Households with children – which are larger – get more per household: on average $574/month for a household with kids, about $174 per person (childless households average only about $177/month per person as noted). But note, those are average values: households at the very bottom (no income and maxed-out allowances) receive higher amounts (the “maximum benefit”), whereas households with some income get smaller payouts. In fact, in FY2022 about 37% of SNAP households received the maximum benefit for their size, and about 10% received the program minimum benefit.
Overall, SNAP injects about $211 (FY2023) per recipient per month into household food budgets. These benefits – when combined with whatever income a family has – make a substantial difference. Analyses show that SNAP raises the incomes of many households: without SNAP, 27% of participant households would be above the poverty line, but including SNAP (and the emergency COVID allotments) that share rises to 57%.
State and Regional Differences
SNAP participation and benefits vary widely by state (and even by county), reflecting differences in poverty, local economies, and state policies. Nationally about 12–13% of residents are on SNAP, but some states are far above or below that. For example, in FY2023 New Mexico had the highest share of its population on SNAP (about 23.1%), followed by states like Louisiana and Mississippi (around 20%). At the other extreme, Utah had just 4.6% of residents on SNAP, along with other Mountain/Western states on the low end. In fact, in 34 states the share of people on SNAP was in the 8–16% range. The map below illustrates this disparity:
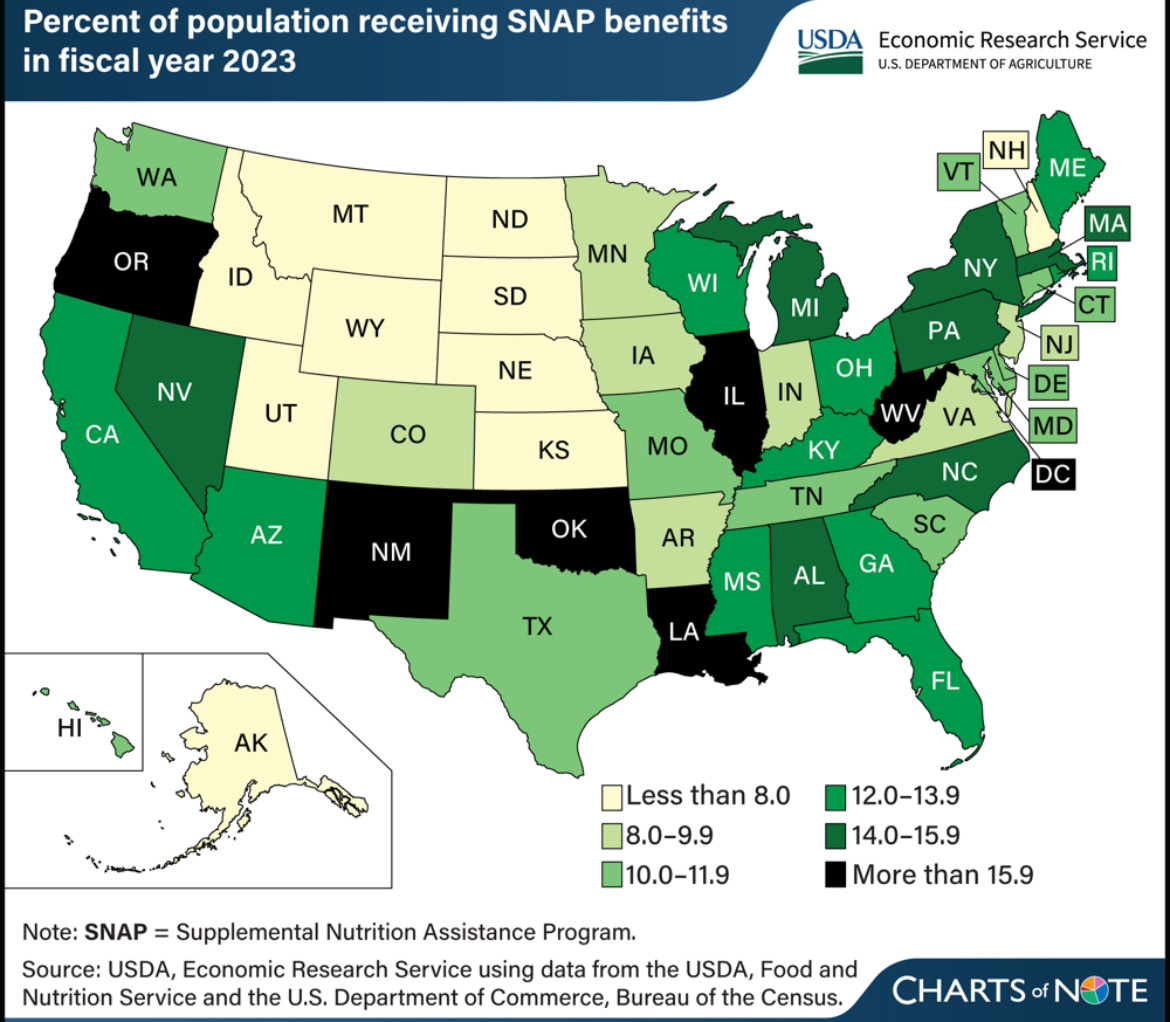
Map: Percent of each state’s population receiving SNAP benefits in FY2023 (darker = higher rate). New Mexico’s SNAP participation was 23.1% (highest), while Utah’s was only 4.6% (lowest)
These geographic differences are influenced by each state’s demographics, poverty rates, cost of living, and how quickly states enroll eligible people. (For example, southern states tend to have higher poverty and thus higher SNAP rates, while some Western states have stricter enrollment rules or lower poverty.) Even within states, counties can differ a lot – rural, low-income counties often have very high SNAP rates. USDA collects data down to the county level (and some analyses show poor rural counties with 25–30% of people on SNAP), though those details are beyond our scope here.
Benefits per household can also differ by state due to cost-of-living and state supplement policies. Some states add extra funds for elderly or disabled households. For example, the maximum allotment for a given family size is slightly higher in Alaska, Hawaii, and territories, but overall the SNAP formula is federal. On average, states with higher living costs (like California or Massachusetts) often have higher average benefits per household than low-cost states (like Indiana or South Dakota), simply because household incomes and needs differ. In any case, data dashboards make it easy to compare state-by-state SNAP statistics (participation rate, average benefit, child vs. adult share, etc.). One national analysis notes that SNAP policy changes – like adopting a higher Thrifty Food Plan – raised benefits everywhere, but the underlying disparities by state remain.
SNAP’s Broader Impacts
Beyond feeding families, research shows SNAP has wide-ranging positive effects. Decades of studies find that SNAP reduces hunger and poverty, improves health outcomes, and boosts local economies. Key impacts include:
Reduces poverty and food insecurity. SNAP plays an important role in keeping millions out of deep poverty. For example, the official Census Supplemental Poverty Measure (which counts non-cash aid) estimates that SNAP (together with other nutrition assistance) lifts about 6.6 million people above the poverty line each year. SNAP also makes households more food-secure. One USDA study found that after 6 months of SNAP participation, the prevalence of food insecurity (skipping meals or not having enough) fell by roughly 5–10 percentage points. In other words, struggling families report much less hunger and hardship once they start receiving SNAP.
Improves health and reduces medical costs. By ensuring families have enough to eat, SNAP has measurable health benefits. Participants have better nutrition (higher intakes of vitamins, minerals, etc.) and lower rates of anemia and other diet-related problems. Young children on SNAP grow better, are less likely to be undernourished or obese, and tend to do better academically than similar children not on the program. Adults on SNAP are likelier to get routine check-ups and less likely to delay medical care due to cost. Critically, SNAP users have significantly lower health care costs: studies find adult SNAP participants have $1,400 to $5,000 lower annual medical costs on average than low-income non-participants. They also use the emergency room far less often. These savings benefit families and taxpayers (lower Medicaid bills) and reduce strain on hospitals.
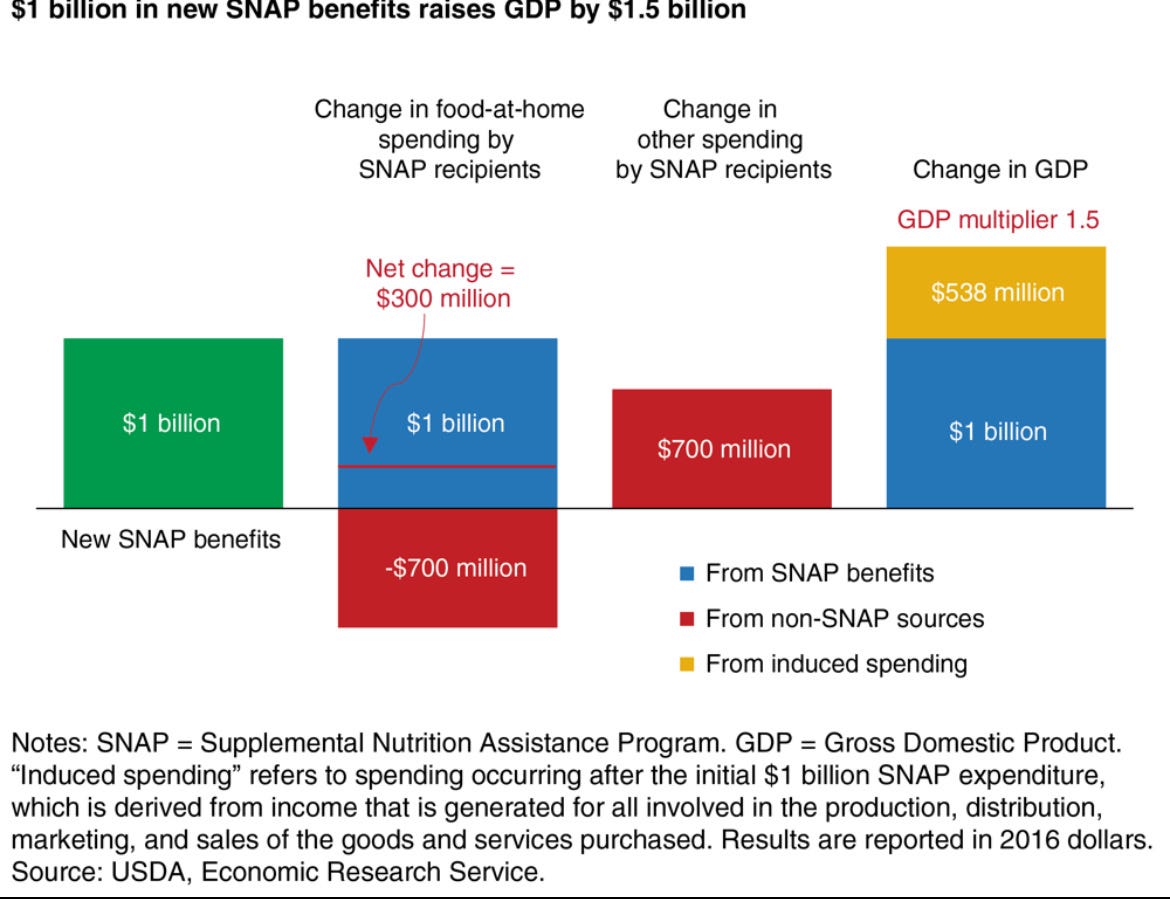
Boosts local economies. SNAP dollars are quickly spent on food and groceries. Most recipients spend nearly all their benefit each month, mainly at supermarkets and grocery stores. Economic researchers estimate that every $1 of new SNAP benefits generates about $1.50 in overall economic output. In practical terms, a $1 billion increase in SNAP spending is projected to raise GDP by about $1.54 billion. This ripple effect supports jobs: USDA-ERS estimates that $1 billion more in SNAP would create roughly 13,560 new jobs nationwide (including around 500 in agriculture and several thousand more in retail and manufacturing). The chart below illustrates this multiplier effect:
Strengthens communities. In areas with many SNAP users, the program helps stabilize local businesses (especially grocery stores and farms). For example, additional SNAP income often means stores buy more food from distributors, which supports truckers, processors, and farmers. SNAP also works alongside other social programs – families on SNAP are more able to pay rent, utilities, or medical bills without going hungry. In sum, SNAP reduces strain on emergency food pantries and hospitals, and it prevents the worst harms of poverty during crises.
These benefits mean SNAP not only feeds individual families, but also pays dividends back to society in the form of lower poverty, healthier children, and stronger local economies. Policymakers and experts broadly agree that SNAP is one of the most cost-effective anti-hunger programs. As economic conditions change, SNAP can expand or contract: for instance, participation spiked during the COVID-19 pandemic (when emergency top-up benefits were in place) and has fallen slightly since. But even in good times, SNAP continues to serve around 40 million people a year .
In conclusion, SNAP remains a critical part of America’s social safety net. By targeting resources to the poorest households (especially those with children, seniors, or disabled members), it ensures that tens of millions of Americans can at least afford basic groceries each month. The program’s documented impacts – from reducing hunger to boosting the economy – underscore why it’s closely watched by researchers and policymakers alike.
If you like this post, check out this interactive dashboard to explore more about SNAP!
https://dallin-overstreet.shinyapps.io/SNAP/